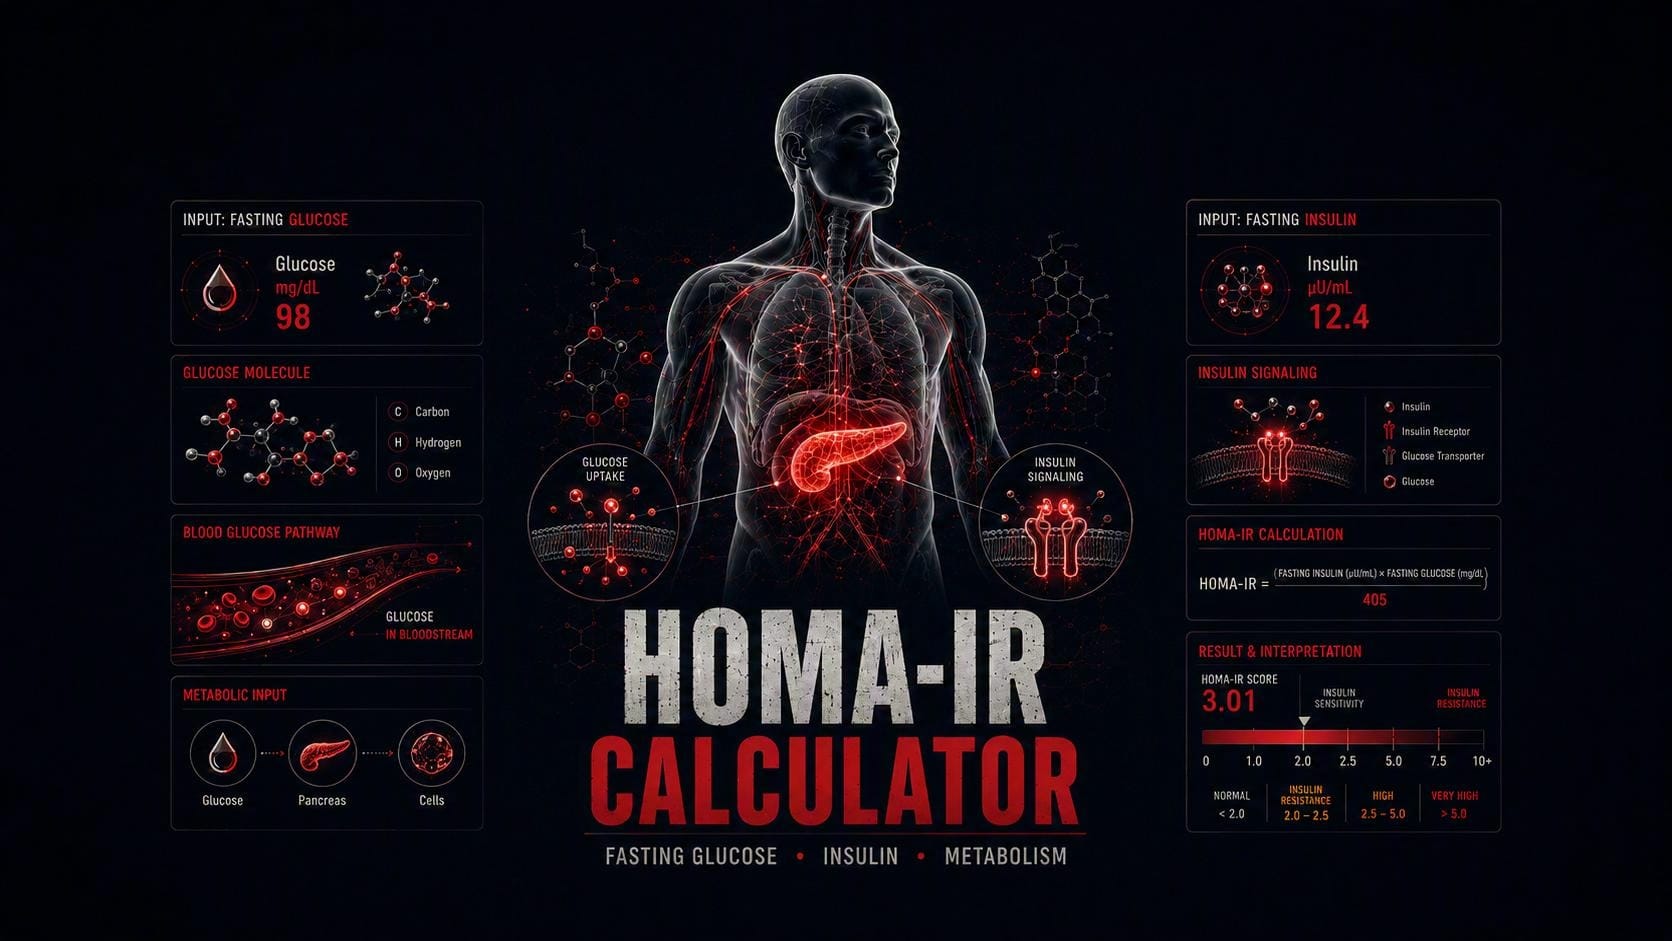
HOMA-IR Calculator:
Insulin Resistance Index
Calculate your HOMA-IR score from fasting glucose and fasting insulin using the Matthews 1985 homeostasis model assessment formula - the most widely validated surrogate marker of insulin resistance in clinical research. Enter values in US or European units and get your score with reference range interpretation.
Estimate insulin resistance from fasting glucose and fasting insulin using the HOMA-IR model. Drag any slider - your category updates live.
Fasting; normal ≈ 70-99 mg/dL
Fasting; typical ≈ 2-12 µIU/mL
Enter fasting glucose and insulin to see your HOMA-IR and insulin-sensitivity category.
HOMA-IR = (fasting glucose × fasting insulin) / 22.5 (glucose in mmol/L, insulin in µIU/mL). Requires truly fasting samples. Thresholds vary by population and assay - an educational estimate, not a diagnosis.
How to use the HOMA-IR calculator
- 1
Enter your fasting glucose
From a morning draw after an 8-12 hour fast, in mg/dL (or mmol/L). Drag the slider or type it in.
- 2
Enter your fasting insulin
From the same fasted draw, in µIU/mL. Order it separately - it is not in a standard metabolic panel.
- 3
Read your HOMA-IR and zone
The tool multiplies the two values and places you from insulin-sensitive to insulin-resistant.
- 4
Watch the trend
Recheck under the same fasting conditions; the direction across several draws is the real signal.
The HOMA-IR calculator estimates insulin resistance from two fasting labs - glucose and insulin. Roughly, under ~1.0 is optimal, up to ~1.9 is average, and 2.0-2.9 and above signals meaningful insulin resistance (thresholds vary by lab and population). Its real power is timing: insulin climbs years before fasting glucose does, so the HOMA-IR calculator flags metabolic trouble long before a standard glucose test blinks.
What this HOMA-IR calculator covers
This HOMA-IR calculator turns a fasting glucose and a fasting insulin into a single index of how hard your body is working to keep blood sugar in check. Unlike generic tools, the HOMA-IR calculator reads that number for the person who lifts, diets or runs a hormone protocol - where growth hormone, caloric surplus and body-fat swings move insulin resistance in ways a one-off glucose test never captures.
How resistant your cells are to insulin, from fasting glucose × fasting insulin.
Insulin rises first; the HOMA-IR calculator catches dysfunction years before fasting glucose or HbA1c move.
Anyone on GH, in a long bulk, or carrying extra fat - all push insulin resistance up.
Insulin resistance - what it is and why it matters
Insulin is the hormone that ushers glucose out of your blood and into muscle, liver and fat. When those cells stop responding well, your pancreas compensates by pumping out more insulin to get the same job done. That state - normal glucose bought at the price of high insulin - is insulin resistance, and it is the quiet engine behind fatty liver, high blood pressure, poor lipids and, eventually, type 2 diabetes.
For anyone chasing size or performance it matters twice over. Insulin resistance blunts nutrient partitioning, makes fat loss harder, and rides alongside the exact things bodybuilders accumulate - visceral fat, long calorie surpluses, and drugs like growth hormone. Catching it early, while it is still just a raised insulin, is exactly what a HOMA-IR calculator is for.
The formula and how the HOMA-IR calculator works
The maths is simple. In conventional US units, HOMA-IR = (fasting glucose in mg/dL × fasting insulin in µIU/mL) ÷ 405. In SI units it is (glucose in mmol/L × insulin) ÷ 22.5. Enter your two fasting values and the HOMA-IR calculator returns the index and places it on a colour scale from insulin-sensitive to resistant.
Two rules make the number trustworthy. Both samples must be fasting (8-12 hours, water only), and both must come from the same draw - because the index multiplies them together, a fed or mismatched sample distorts the result badly. Get those right and the HOMA-IR calculator becomes a cheap, repeatable way to watch your metabolic health over time.
HOMA-IR reference ranges
There is no single universal cut-off, but the commonly used bands the HOMA-IR calculator maps to are: below 1.0 optimal and insulin-sensitive; 1.0-1.9 average; 2.0-2.9 early or emerging insulin resistance; 3.0-4.9 significant resistance; and 5.0 or higher severe. Populations and assays shift these lines, so treat the zone and the trend as the signal, not a single decimal place.
A reading creeping from 1.2 to 2.4 across a bulk tells you more than any single number. Run the HOMA-IR calculator under the same fasting conditions each time and watch the direction - that is where the early warning lives.
Insulin rises before glucose - the real value of HOMA-IR
The reason the HOMA-IR calculator earns its place is timing. In the slow slide toward metabolic disease, fasting glucose is the last thing to break: your pancreas holds the line for years by secreting ever more insulin. A standard glucose test stays reassuringly normal that whole time. Because it includes insulin, the HOMA-IR calculator sees the compensation happening and rings the bell early - while the problem is still fully reversible.
“By the time fasting glucose rises, insulin resistance has usually been building for years. HOMA-IR is how you catch it while it is still just a number, not yet a diagnosis.”
MuscleScience editorial standardThat early-warning window is exactly why the HOMA-IR calculator belongs in a lifter’s bloodwork. A rising number during a long surplus or a GH cycle is a prompt to act - tighten the diet, add cardio, reconsider the compounds - long before anything shows up on a routine metabolic panel.
How PEDs affect HOMA-IR
Growth hormone is the big one. GH is a direct insulin antagonist: it drives up blood glucose and forces insulin higher, so the HOMA-IR calculator reading climbs on GH almost by design. That is well documented in the endocrinology literature, and it is why GH users so often drift into measurable insulin resistance - sometimes managed, dangerously, with injected insulin.
The supporting cast matters too. Long caloric surpluses and rising body fat worsen insulin resistance directly, and some oral anabolic steroids nudge glucose handling and lipids the wrong way. The flip side is encouraging: dropping body fat, adding conditioning work and easing off GH all pull the number back down, usually faster than people expect.
Fasting insulin is not in a standard panel
Here is the practical catch that trips most people up: you cannot feed a HOMA-IR calculator from a routine blood test, because fasting insulin is not part of a standard comprehensive or basic metabolic panel. You have to request it specifically.
Ask your doctor or lab for a “fasting insulin” test alongside your fasting glucose. Many physicians will add it if you explain you are tracking HOMA-IR for metabolic monitoring, and some metabolic-syndrome panels already include it. Without fasting insulin, the HOMA-IR calculator has nothing to compute.
Draw both after an 8-12 hour fast, from the same sample, ideally in the morning. That one extra tube is the difference between a full metabolic picture and a fasting glucose that quietly under-reports your risk.
Limitations - and the HOMA2 upgrade
A HOMA-IR calculator gives you a model, not a measurement. It is a single fasting snapshot, so it says nothing about how you handle a meal, and it leans heavily on the insulin assay - insulin methods vary between labs, so numbers are best compared within the same lab over time. It also assumes a working pancreas; in advanced diabetes with failing beta cells the original equation loses accuracy.
“A single HOMA-IR above the line means I am insulin resistant.” One reading is a flag, not a diagnosis. Confirm it fasted, repeat it, and read it with your other markers and symptoms - the trend across draws is what counts.
For extreme values, the updated HOMA2 computer model corrects the assumptions in the original 1985 equation and is preferred by researchers. For everyday tracking, though, the classic HOMA-IR calculator this page uses is more than good enough to watch your own trend.
A worked HOMA-IR example
Say your fasting glucose is 95 mg/dL and your fasting insulin is 12 µIU/mL. Enter those into the HOMA-IR calculator: (95 × 12) ÷ 405 = about 2.8 - sitting in the emerging-resistance band even though that 95 glucose would be waved through as perfectly normal on its own. The insulin is what gives the game away.
Now imagine the same person leans out over a few months and their fasting insulin drops to 6. The HOMA-IR calculator returns (95 × 6) ÷ 405 = about 1.4 - back into the normal band, on an unchanged glucose. That is the story it tells that a glucose test cannot: the metabolic improvement showed up entirely in the insulin.
How to improve a high HOMA-IR
- Lose visceral fat. The single biggest lever - even modest fat loss sharply improves insulin sensitivity.
- Lift and add conditioning. Resistance training plus regular cardio makes muscle soak up glucose with less insulin.
- Cut refined carbs and sugar. Lowering the glucose load eases the insulin demand behind a high reading.
- Reassess GH and insulin use. Growth hormone drives resistance up; easing off, or managing it with a clinician, brings it back.
- Sleep and stress. Poor sleep and chronic stress raise insulin resistance independently of diet.
Common mistakes with a HOMA-IR calculator
- Not fasting. A fed glucose or insulin wrecks the calculation - both values must be fasted, from one draw.
- Forgetting to order insulin. It is not in a standard panel; without fasting insulin there is no HOMA-IR to calculate.
- Comparing across labs. Insulin assays differ; track your trend within the same lab.
- Acting on one number. A single high reading is a prompt to repeat and investigate, not a diagnosis.
- Ignoring it on GH. Growth hormone reliably raises HOMA-IR - monitor it, do not assume it is fine.
HOMA-IR calculator FAQ
The questions people ask most before trusting a HOMA-IR calculator result.
What is a good HOMA-IR score?
Below about 1.0 is optimal and up to ~1.9 is average; 2.0-2.9 and above suggests insulin resistance. Cut-offs vary by lab and population, so judge the zone and the trend rather than a single decimal.
Why is my HOMA-IR high when my glucose is normal?
Because insulin rises first. Your pancreas keeps glucose normal by making more insulin, so a normal glucose with high insulin still gives a high HOMA-IR - which is exactly the early warning the HOMA-IR calculator is designed to catch.
Do I have to fast for it?
Yes. Both fasting glucose and fasting insulin must be drawn after 8-12 hours without food, from the same sample. A fed sample makes the number meaningless.
Does growth hormone or TRT affect HOMA-IR?
Growth hormone raises it - GH is an insulin antagonist that pushes insulin resistance up. Extra body fat and long calorie surpluses worsen it too. Testosterone itself is broadly neutral to favourable, but the overall protocol and body composition are what move the number.
Is a HOMA-IR calculator reliable?
For tracking your own trend, yes - it correlates well with the gold-standard glucose clamp. It is assay-dependent and a single fasting snapshot, so use the same lab, repeat it, and interpret it with a clinician rather than treating one value as a verdict.
HOMA-IR - key takeaways for metabolic monitoring
The HOMA-IR calculator turns two fasting labs into an early read on insulin resistance - and its value is that it moves years before fasting glucose does. Under ~1.0 is optimal, and anything drifting past ~2.0-2.9 is worth acting on, especially during a bulk or on growth hormone, where a rising number is the expected cost of the protocol.
Track HOMA-IR at every bloodwork draw alongside fasting glucose and fasting insulin, read the trend rather than one figure, and pair it with your lipids, blood pressure and kidney markers for a complete metabolic picture. Resources below for the full monitoring context.
How to use your HOMA-IR in practice
Turn the number into a decision with a simple routine:
- Order fasting glucose AND fasting insulin together, after an 8-12 hour fast, from the same morning draw.
- Calculate it on the HOMA-IR calculator here and note the zone alongside your glucose and insulin values.
- Read the trend across several draws, using the same lab, rather than reacting to one number.
- If it is climbing, look at body fat, diet, conditioning and any GH use before anything else.
- Pair it with lipids, blood pressure and kidney markers, and confirm anything abnormal with your clinician.
References
Every PMID on this page is verified against the PubMed record (title, author, journal and year) before it is published.
Final educational note
This HOMA-IR calculator and the content on this page are provided for educational purposes only. HOMA-IR is a surrogate estimate of insulin resistance derived from a mathematical model - it is not a direct measurement of insulin-mediated glucose disposal and is subject to variation from assay methodology, biological variability, and fasting-state compliance.
A single HOMA-IR result above any reference threshold is not a diagnosis. Clinical interpretation requires fasting-state confirmation, repeat testing, and evaluation by a qualified physician in the context of full metabolic panel results, symptoms and medical history. Nothing on this page constitutes medical advice. See our full Disclaimer.
MuscleScience.org does not sell supplements, therapy programmes, or medical services. This is an educational publication only.