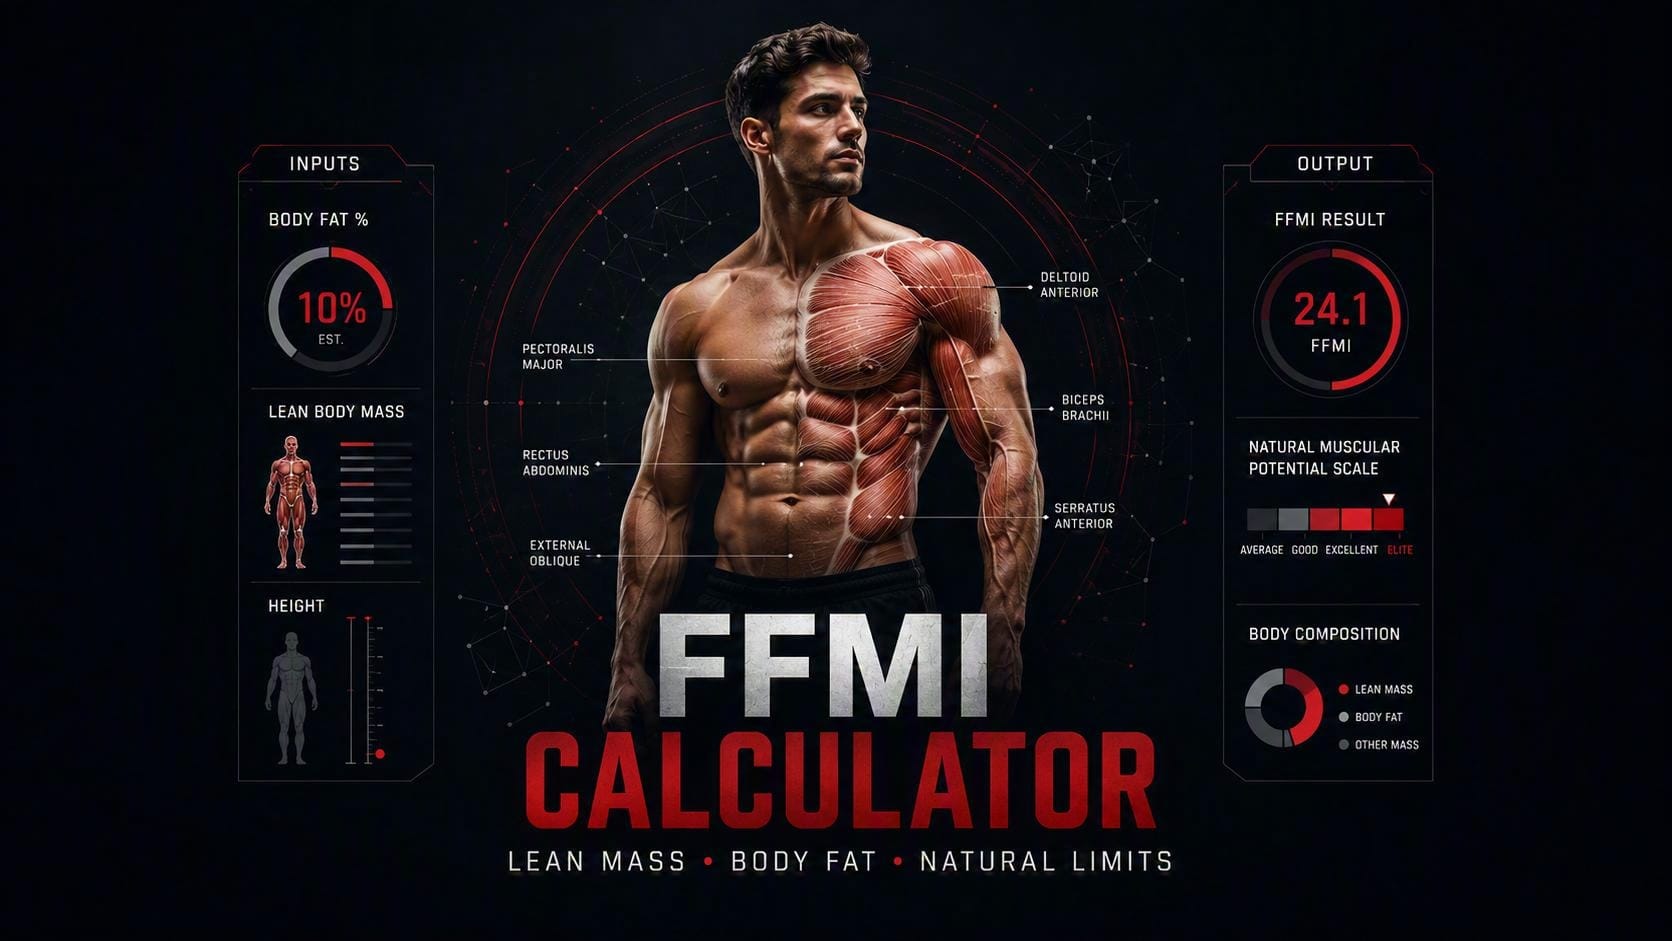
FFMI Calculator:
Fat-Free Mass Index
This FFMI calculator computes your fat-free mass index from body weight, height, and body fat percentage. FFMI is the most reliable metric for assessing muscular development relative to frame size - and the standard reference point for evaluating natural vs. enhanced physiques in research and competitive bodybuilding.
FFMI measures how much lean mass you carry for your height - a muscle metric that isn’t fooled by scale weight. The height-adjusted value even hints at the natural ceiling. Drag any slider to update live.
Bodyweight
Standing height
Use a good estimate
Enter weight, height and body-fat % to see your FFMI and where it sits.
FFMI = lean mass / height²; adjusted FFMI normalises to 1.8 m. ~25 is often cited as the drug-free ceiling, but genetics, measurement error and body-fat accuracy all move it - treat it as a guide, not a verdict.
How to use the FFMI calculator
- 1
Pick units and sex
Metric or imperial, male or female.
- 2
Enter weight, height and body fat %
Body fat is the sensitive input - a few points off shifts your FFMI, so measure it well.
- 3
Read your normalized FFMI
Adjusted to a 1.8 m frame so tall and short lifters compare fairly.
- 4
Compare to 25
That is the natural ceiling from Kouri’s data - see where you land.
Where lifters sit vs the natural ceiling
25 is the natural FFMI ceiling (Kouri 1995).
How to read your result
Untrained, or plenty of natural room to grow - this climbs fast with consistent training.
Solid natural progress. Most trained drug-free lifters land here.
Approaching the natural ceiling. Gains slow and every point is hard-won.
Beyond the drug-free ceiling in Kouri’s data - rare without help.
An FFMI above 25 does not prove PED use, but drug-free lifters almost never pass it (Kouri 1995). First re-check your body-fat input - a too-low body-fat estimate inflates FFMI.
What This FFMI Calculator Measures
This FFMI calculator computes fat-free mass index from body weight, height, and body fat percentage. FFMI expresses the amount of lean mass you carry relative to your height squared - the same mathematical structure as BMI, but applied to fat-free mass rather than total body weight. It is the most commonly used single metric for comparing muscular development across individuals of different heights and body sizes.
FFMI, adjusted FFMI normalised to 1.80m, and lean body mass in kg or lbs. Classification across five tiers from below average to above the natural ceiling.
FFMI = LBM / height². Adjusted FFMI = FFMI + 6.1 × (1.80 − height in meters). Based on Kouri et al. 1995 methodology.
Natural bodybuilders tracking muscular development, physique competitors assessing contest readiness, and anyone benchmarking lean mass against validated population data.
Accurate body fat percentage is critical for a valid FFMI result. A 3% error in body fat input shifts FFMI by approximately 0.8 points at 90kg - enough to change classification tier. Use the most accurate body fat method available. For body fat estimation: BMI & Body Fat Calculator. For training context: What Builds Muscle and Progressive Overload Explained.

FFMI vs BMI - Why Fat-Free Mass Index Is the Better Metric for Athletes
BMI (body mass index) divides total body weight by height squared. For sedentary populations it is a reasonable proxy for adiposity. For athletes and trained individuals it fails systematically - a 95kg competitive bodybuilder at 10% body fat and a 95kg sedentary adult at 30% body fat have identical BMIs despite radically different body compositions. BMI cannot distinguish fat mass from lean mass, making it clinically meaningless for anyone who trains seriously.
FFMI solves this by using lean body mass - total weight minus fat mass - as the numerator instead of total weight. Two athletes at the same height with identical training histories but different fat levels will produce different BMIs and the same FFMI if their lean mass is equal. This makes FFMI the appropriate metric when the goal is to assess muscular development rather than overall body size.
What FFMI Does Not Measure
FFMI is a proxy for muscle mass, not a direct measurement. Lean body mass includes organs, bone, water, connective tissue, and glycogen in addition to skeletal muscle. A heavily hydrated athlete will show a higher FFMI than when depleted, despite identical muscle mass. Athletes with dense bones or large organ mass will trend higher than those with lighter skeletal frames at equivalent muscle development. These sources of variance are inherent to any body-weight-based metric and are why FFMI should be tracked as a trend rather than treated as a precise absolute value.
FFMI Reference Ranges and the Natural Ceiling - What the Research Shows
The foundational FFMI reference data for bodybuilding contexts comes from Kouri et al. (1995, PMID 7489157), who measured FFMI in 157 athletes - 83 steroid users and 74 non-users - recruited from gymnasiums. The study established that natural athletes rarely exceeded an adjusted FFMI of 25.0, while steroid users clustered significantly above this threshold. This figure has since become the most widely cited natural bodybuilding ceiling in sports science literature.
| Adjusted FFMI | Classification | Typical Profile |
|---|---|---|
| <18.0 | Below average | Untrained or significant caloric deficit |
| 18.0-19.9 | Average | Recreational trainee, 1-2 years consistent training |
| 20.0-21.9 | Above average | Dedicated trainee, 3-5 years, good programming |
| 22.0-23.9 | Excellent | Advanced natural athlete, competitive natural bodybuilder |
| 24.0-24.9 | Superior - upper natural limit | Elite natural genetics, many years of optimised training |
| ≥25.0 | Above natural ceiling | Rare naturally; statistically associated with PED use |
Why 25 Is Not an Absolute Wall
The FFMI of 25 is a statistical threshold, not a physiological hard limit. Individuals with exceptional genetics - very high myostatin-inhibiting gene variants, superior androgen receptor density, or unusually dense musculature - can theoretically exceed 25 naturally. Elite natural bodybuilding competitors in drug-tested federations have occasionally recorded adjusted FFMIs of 25-26 when body fat is measured precisely by DEXA rather than estimated. The 25 cutoff should be understood as the point above which steroid use becomes increasingly probable, not as a ceiling that is physically impossible to breach without drugs.
Body fat accuracy also affects this threshold significantly. If body fat is underestimated by 3%, a true FFMI of 23.5 can appear as 25.1 in the FFMI calculator. This is the most common source of inflated FFMI scores - particularly among individuals using BIA scales or self-estimated body fat.
How to Use FFMI to Track Muscle Growth Over Time
FFMI is most useful as a longitudinal tracking metric rather than a single snapshot. Because it normalises lean mass to height, it allows direct comparison of progress across different body weights, training phases, and dietary protocols. A natural trainee starting at FFMI 17 who reaches 21 after four years of progressive training has made substantial and quantifiable muscular progress regardless of what the scale shows during bulking and cutting cycles.
FFMI During a Bulk
During a caloric surplus phase, total weight increases - but so does fat mass. FFMI should increase if muscle is being accrued faster than fat. If FFMI remains flat or declines during a bulk, the surplus is producing predominantly fat gain rather than lean tissue. Tracking FFMI monthly during a bulk provides a more informative signal than scale weight alone. See Training Volume Explained and Progressive Overload Explained for the training-side variables that determine lean gain rate during a surplus.
FFMI During a Cut
During a caloric deficit, the goal is fat loss with lean mass preservation. FFMI should remain stable or increase slightly as body fat drops while lean mass is maintained. A declining FFMI during a cut signals muscle loss - too steep a deficit, insufficient protein, inadequate training stimulus, or excessive cardio volume. For nutritional context during a cut: Calories and Energy Balance and Protein Intake Explained.
Rate of FFMI Progress by Training Age
Lyle McDonald’s muscle gain model - consistent with research on protein synthesis rates - suggests natural trainees can accrue lean mass at the following approximate rates: Year 1: 0.9-1.1 kg/month. Year 2: 0.45-0.55 kg/month. Year 3: 0.2-0.27 kg/month. Year 4+: 0.1-0.15 kg/month. For a 180cm male, each kg of lean mass represents approximately 0.3 FFMI points. Progress slows sharply as training age increases - which is why FFMI growth rate naturally decelerates even with consistent training.
4 Mistakes When Using an FFMI Calculator
- 1. Using inaccurate body fat input. FFMI is only as accurate as the body fat percentage entered. BIA scale readings, which fluctuate with hydration, meal timing, and glycogen status, can produce 3-5% errors. A 3% body fat error on a 90kg individual shifts FFMI by nearly 1.0 point - crossing classification tiers. Use DEXA when available; use the Navy circumference method as a minimum standard for consistent tracking.
- 2. Using FFMI as a binary natural/enhanced detector. FFMI above 25 is a statistical signal, not a definitive test. An athlete at FFMI 24.8 with inaccurate body fat measurement may actually be at 23.5. An athlete at 25.3 may be a genuine natural outlier. FFMI is a probabilistic screen, not a polygraph. It is most useful for self-assessment and trend tracking, not for making accusations.
- 3. Ignoring the adjusted FFMI value. Raw FFMI without height adjustment systematically disadvantages shorter athletes and benefits taller ones. A 165cm individual and a 190cm individual with identical lean mass will have the same raw FFMI but different adjusted FFMIs. The adjusted figure normalised to 1.80m is the appropriate comparison metric across different heights - use it, not the raw FFMI, when comparing to reference ranges.
- 4. Expecting linear progress toward the ceiling. Natural FFMI progress is logarithmic - fastest in the first 1-2 years, progressively slower thereafter. Expecting to gain 1 FFMI point per year after 5+ years of training is unrealistic. At advanced training ages, maintaining FFMI while reducing body fat during a cut is significant progress. Reframe success metrics accordingly.
References
- Kouri EM, Pope HG Jr, Katz DL, Oliva P. (1995). Fat-free mass index in users and nonusers of anabolic-androgenic steroids. Clinical Journal of Sport Medicine. PMID: 7496846.
- Kyle UG, Schutz Y, Dupertuis YM, Pichard C. (2003). Body composition interpretation: contributions of the fat-free mass index and the body fat mass index. Nutrition. PMID: 12831945.
- Schutz Y, Kyle UG, Pichard C. (2002). Fat-free mass index and fat mass index percentiles in Caucasians aged 18-98 y. International Journal of Obesity and Related Metabolic Disorders. PMID: 12080449.
- Janssen I, Heymsfield SB, Wang ZM, Ross R. (2000). Skeletal muscle mass and distribution in 468 men and women aged 18-88 yr. Journal of Applied Physiology. PMID: 10904038.
FFMI Calculator - Key Takeaways
FFMI is the most practical single metric for assessing muscular development relative to height. Track it longitudinally alongside body fat percentage - ideally at the same measurement conditions each time. Use adjusted FFMI for cross-height comparisons. Treat the natural ceiling of 25 as a probabilistic signal, not a hard physiological limit, and account for body fat measurement accuracy before drawing conclusions.
Final Educational Note
This FFMI calculator and the content on this page are provided for educational purposes only. FFMI is a mathematical estimate derived from body weight, height, and body fat percentage - all of which carry measurement error. Results are not a diagnostic tool for PED use and should not be used to make accusations or clinical decisions.
Body composition assessment requires professional evaluation for clinical purposes. Nothing on this page constitutes medical or dietary advice. MuscleScience.org does not sell supplements, therapy programmes, or medical services.